Build your weekly report once, and stop rebuilding it every Monday
Every Monday, the same message lands: "Can you send me the weekly numbers?"
If you lead a support, sales or customer success team, you know what comes next. You open one report, apply your filters and copy the figures you need. Then you open another report and do it all again. The spreadsheet takes longer than the question deserves.
Aircall Analytics has more than 130 metrics across 10 reports. Most managers need about ten metrics. The trouble is that those ten metrics rarely sit on the same page.
Meet Custom analytics dashboards
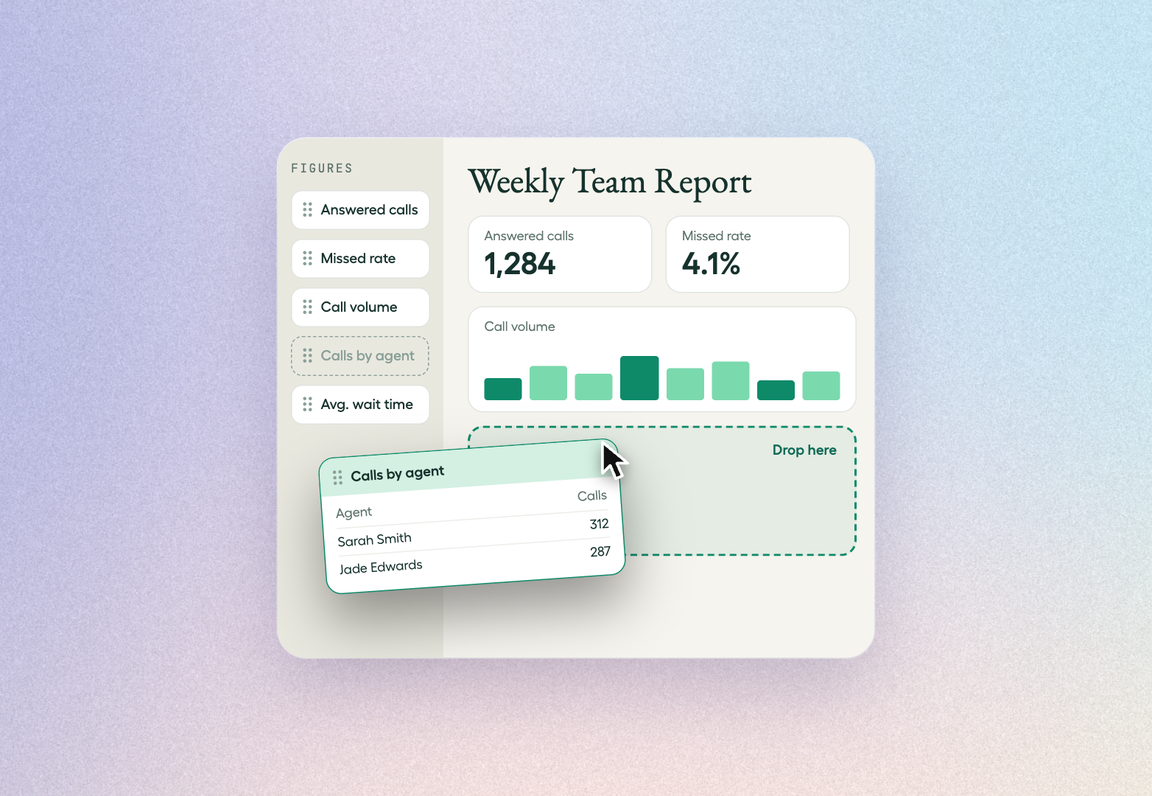
Custom analytics dashboards are now available on Analytics+. It lets you build the report your team actually needs. You choose the figures, you decide the layout and you set your filters once. Then you save it, and it is there whenever someone asks for the numbers.
Here is what you can do:
Pick from the figures that already exist across your Analytics pages, in one searchable library
Group figures into named sections and drag them into the order you want
Set a date range and filters once for the whole report
Save the report and export it to CSV, XLSX or PDF
Build your first report in five steps
Open Analytics in your Aircall dashboard, select Custom analytics dashboards, then click New report.
Give the report a name, for example "Weekly Performance".
Search the figure library and drag in the figures you need. Add a section for each theme, such as Inbound or Team activity.
Set the date range and any filters in the report header. They apply to every figure in the report.
Click Save.
Your dashboard is now created. You can apply and save preset filters.
When someone asks for the numbers, export the report to CSV, XLSX or PDF.
For a full walkthrough, read the step-by-step guide.
A report that fits how your team works
Different teams need different numbers. Here are three ways to start:
Support and operations: a weekly performance report for leadership, built from Inbound and User Activity figures
Sales: outbound activity and connection figures for the weekly pipeline meeting
Customer success and RevOps: one report that mixes Overview, Inbound and Outbound figures for QBRs and leadership updates
Good to know
Custom analytics dashboards are available with the Analytics+ add-on.
Reports are saved to your account and are private to you.
Save filters on your report for the next time you use it.
You choose when to export in your preferred format: CSV, XLSX or PDF.
Try it today
On Analytics+? Build your first report in Analytics > Custom Dashboards.
Not on Analytics+ yet? Learn more about Analytics+ or book a demo.
Published on .
Ready to build better conversations?
Simple to set up. Easy to use. Powerful integrations.
Get started